
Master Your Money: The Power of a Spreadsheet for Financial Management
In the quest for financial stability, many tools promise to simplify the process. While budgeting apps offer convenience, the humble spreadsheet remains one of the most powerful, flexible, and free tools for managing your money. It gives you complete control, a deeper understanding of your financial flow, and the ability to customize your system precisely to your needs. If you’re looking to take a hands-on approach to your finances, learning how to use a spreadsheet is an invaluable skill.
Why a Spreadsheet?
Before diving in, let’s understand why spreadsheets (like Google Sheets, Microsoft Excel, or LibreOffice Calc) are so effective for money management:
- Customization: Unlike rigid apps, a spreadsheet lets you create categories, formulas, and visual representations exactly how you want them.
- Visual Clarity: You can easily see your income, expenses, and savings at a glance, making financial patterns clearer.
- Deeper Understanding: Manually inputting data forces you to confront where your money is going, leading to more mindful spending.
- Cost-Effective: Most spreadsheet software is free or already part of your existing software suite.
- Accessibility: Your spreadsheet can be accessed from any device with an internet connection (if using cloud-based options like Google Sheets).
Getting Started: The Basic Setup
To begin, open a new spreadsheet. The core principle is simple: track your income and track your expenses.
1. Create Key Tabs/Sheets:
- “Overview” or “Dashboard”: This will be your main summary.
- “Income”: To record all money coming in.
- “Expenses”: To log every outflow of cash.
- “Budget Categories”: A list of your spending categories.
- “Savings/Debt Tracking” (Optional, but Recommended): For specific goals.
2. Set Up Your “Income” Tab:
- Columns:
DateSource(e.g., “Salary,” “Freelance Gig,” “Tax Refund”)AmountNotes(Optional: e.g., “Bi-weekly pay”)
- Data Entry: Enter each income payment as it comes in.
3. Set Up Your “Expenses” Tab:
- Columns:
DateCategory(e.g., “Groceries,” “Rent,” “Transportation”)Description(e.g., “Supermarket trip,” “Gas for car,” “Dinner with friends”)AmountPayment Method(Optional: e.g., “Debit Card,” “Credit Card,” “Cash”)
- Data Entry: This is the most crucial part. Every time you spend money, log it immediately. This daily habit prevents you from forgetting transactions.
4. Define Your “Budget Categories” Tab:
- This tab simply lists all the categories you’ve decided on for your expenses. Examples:
- Housing (Rent/Mortgage)
- Utilities (Electricity, Water, Internet)
- Food (Groceries, Dining Out)
- Transportation (Gas, Public Transit, Car Maintenance)
- Healthcare (Medications, Co-pays)
- Debt Payments (Credit Cards, Loans)
- Personal Care (Haircuts, Toiletries)
- Entertainment
- Clothing
- Savings
- Miscellaneous
- Tip: Keep your categories broad enough to be manageable, but specific enough to be insightful.
Building Your Budget in the “Overview” Tab
This is where all your data comes together.
1. Project Your Income:
- At the top of your “Overview” tab, list your expected monthly income. If it varies, use an average or a conservative estimate.
2. Set Up Your Budget:
- List each of your “Budget Categories” down a column.
- Next to each category, create two columns:
Budgeted AmountandActual Spent. - Fill in the
Budgeted Amountfor each category (e.g., R$800 for Rent, R$400 for Groceries). Be realistic, especially when starting out.
3. Link Your Expense Data:
- This is where formulas shine. In the
Actual Spentcolumn for each category, you’ll use aSUMIFformula. This formula adds up all the amounts from your “Expenses” tab that match a specific category. - Example Formula (for a “Groceries” category, assuming your categories are in column B and amounts in column D of your “Expenses” tab):
=SUMIF(Expenses!B:B, "Groceries", Expenses!D:D) - Drag this formula down for all your categories. Now, as you enter expenses in the “Expenses” tab, your
Actual Spentwill update automatically!
4. Calculate the Difference:
- Add a column for
DifferenceorRemaining. - Formula:
Budgeted Amount - Actual Spent. - Positive numbers mean you’re under budget; negative numbers mean you’ve overspent.
5. Add Totals:
- Sum up your
Budgeted AmountandActual Spentcolumns to see your total budgeted expenses versus total actual expenses. - Calculate your overall net income:
Total Income - Total Actual Spent. This shows your true financial standing.
Advanced Tips for Spreadsheet Mastery
- Conditional Formatting: Highlight cells automatically. For instance, make
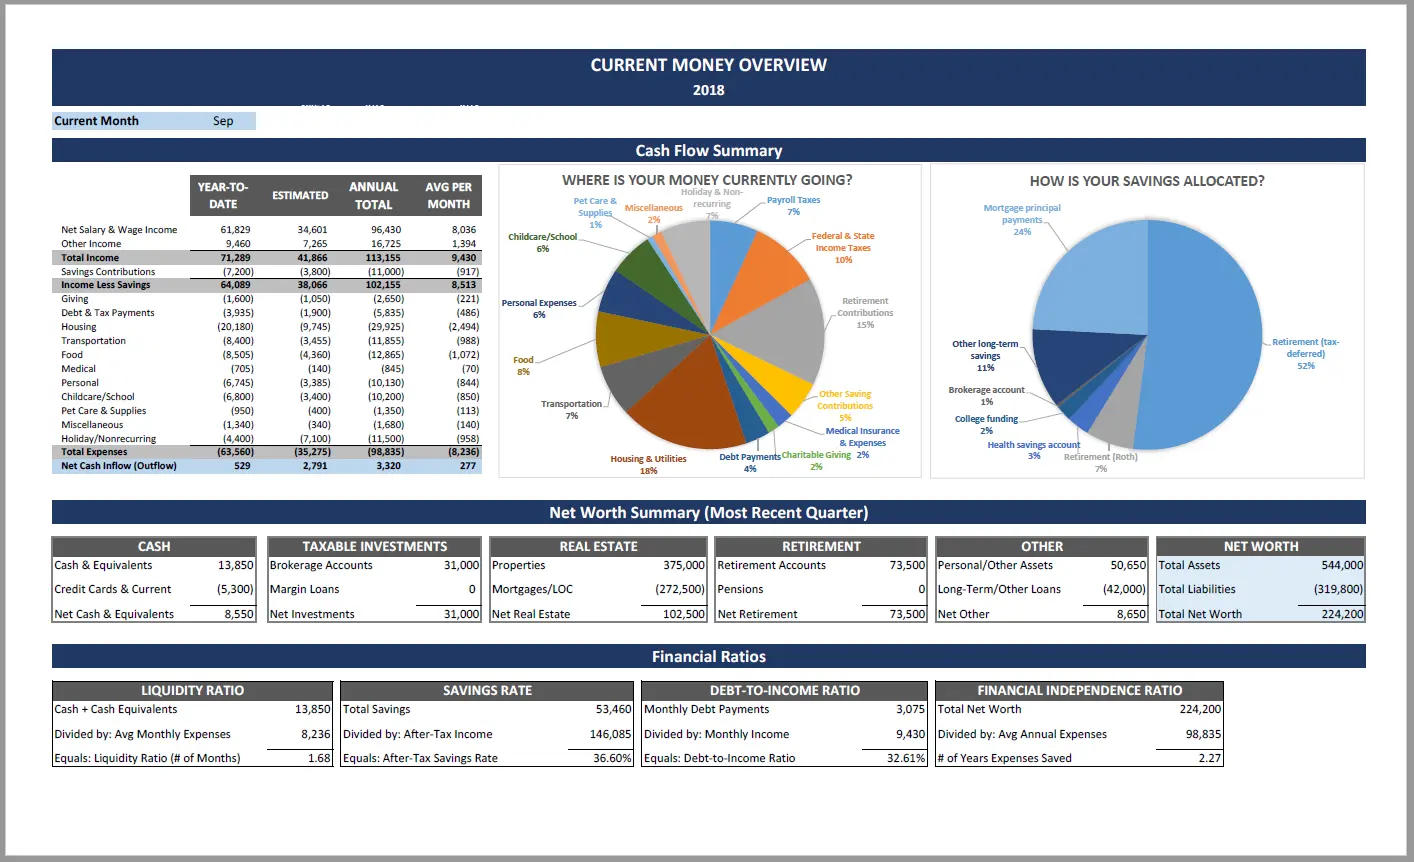
Differencecells turn red if negative (over budget) and green if positive (under budget). - Charts and Graphs: Create pie charts of your spending by category or bar graphs comparing budgeted vs. actual amounts. Visuals make trends easier to spot.
- Savings Goals Section: Add a section to track progress towards specific savings goals (e.g., “Emergency Fund,” “Vacation Fund”). Link transfers from your bank statements to these goals.
- Debt Repayment Tracking: Create a dedicated section to monitor your debts, including principal, interest paid, and remaining balance.
- Regular Review: Set a weekly or bi-weekly reminder to update your expenses and review your budget. This consistency is crucial.
Using a spreadsheet might seem like a bit more effort upfront than an app, but the deep understanding and complete control it provides are unparalleled. It transforms passive money management into an active, empowering habit, giving you the clarity needed to make informed financial decisions and work towards your goals. Start simple, be consistent, and watch your financial clarity grow.
If you’re looking for a simple, customizable, and powerful way to manage your money, look no further than a spreadsheet. Whether you’re a beginner or someone looking to upgrade your financial habits, a spreadsheet is one of the most effective tools for taking control of your budget, tracking expenses, and reaching your goals.
In this article, you’ll learn step-by-step how to use a spreadsheet to organize your finances, along with practical templates and tips to help you get started.
Why Use a Spreadsheet?
A spreadsheet gives you full visibility and control over your finances. Here are some reasons why it’s so effective:
- Customizable: You can tailor it to your income, lifestyle, and financial goals.
- Visual: Charts and graphs make it easier to see your progress.
- Accessible: Available for free via Google Sheets, Excel, or LibreOffice.
- Secure: Your data stays with you (no third-party app access required).
Step 1: Choose Your Platform
There are several tools you can use to build your budget spreadsheet:
- Google Sheets (Recommended): Free, cloud-based, and accessible from anywhere.
- Microsoft Excel: Powerful features for those familiar with formulas.
- LibreOffice Calc: A great free alternative for offline use.
If you’re new to spreadsheets, Google Sheets is the most beginner-friendly and doesn’t require software installation.
Step 2: Set Up Your Spreadsheet Structure
Start with three basic sections:
1. Income
Include:
- Salary (after taxes)
- Freelance or gig work
- Any recurring passive income
2. Expenses
Split into categories:
- Fixed Expenses: Rent, insurance, subscriptions
- Variable Expenses: Food, transportation, entertainment
- Debt Payments: Loans, credit cards
- Savings: Emergency fund, retirement, vacation
3. Summary
This is where you calculate:
- Total income
- Total expenses
- Monthly balance (Income – Expenses)
Use formulas like:
excelCopiarEditar=SUM(B2:B10)
To quickly add up totals.
Step 3: Input Your DataEnter your numbers for each category. For example:
| Category | Amount |
|---|---|
| Rent | $900 |
| Groceries | $300 |
| Transportation | $100 |
| Subscription | $50 |
| Emergency Fund | $150 |
| Income (Total) | $2,000 |
Track these numbers throughout the month or update them weekly to stay accurate.
Step 4: Use Formulas to Automate Calculations
Spreadsheets become much more powerful when you use basic formulas:
=SUM()– Add multiple values=A1-B1– Subtract expenses from income=IF()– Add logic (e.g., highlight overspending)
Also use conditional formatting to color-code high expenses or highlight categories where you’re over budget.
Step 5: Add Charts and Graphs
Visual elements make it easier to understand your financial behavior.
Popular chart ideas:
- A pie chart to show expense breakdowns
- A bar chart comparing income vs. spending
- A line graph to track savings growth over time
Google Sheets and Excel both have simple chart builders you can use in just a few clicks.
Step 6: Make It a Habit
A spreadsheet only works if you update it consistently. Here’s how to build the habit:
- Set a weekly “money review” time (15–30 mins)
- Track receipts or use your banking app to review purchases
- Adjust the spreadsheet as needed when your income or expenses change
With time, updating your spreadsheet will become second nature.
Bonus: Download Free Budget Templates
Don’t want to build one from scratch? No problem.
Here are a few free resources:
- Google Sheets Budget Template: Available in Google Sheets under “Template Gallery”
- Vertex42 (vertex42.com): Dozens of Excel/Sheets templates for budgeting, savings, debt tracking
- Tiller Money (tillerhq.com): Automated Sheets templates with optional premium automation
Final Thoughts: A Simple Tool, a Big Impact
You don’t need expensive software to manage your money. A basic spreadsheet — even just rows and columns — can give you the clarity and structure you need to improve your finances.
Start simple. Be consistent. And remember, managing your money is less about perfection and more about awareness. A spreadsheet puts that awareness right in front of you, every time you open it.